Reporting Dashboard
Video Tutorial
The Reporting Dashboard is a tabular based reporting tool that allows Report authors to query and display any data managed by the system.
Each Report is defined by an XML-style script comprised of SQL queries and instructions that control how the data is displayed.
The output of each Report can be displayed directly in versaSRS or exported to HTML, MS Word, MS Excel, CSV, and PDF. You can also create versaBoards that contain the Report, allowing for dynamic viewing and live updates of the Report data.
The Reporting Dashboard now returns JSON data for client side rendering, offering greater flexibility for versaBoard design.
The Reporting Dashboard can be accessed by clicking on the Reporting option within the Navigation Sidebar.
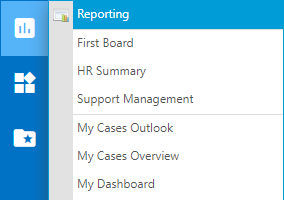
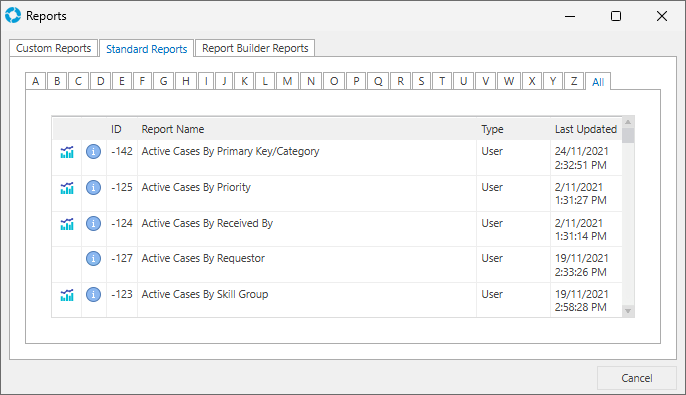
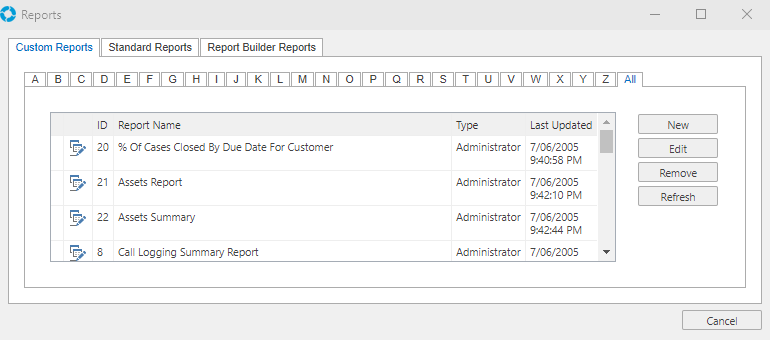
When selected it will bring up the Reports window where Reports can be selected by double clicking on them to view in the Reporting Dashboard.
Managing Reports
Reports can be managed by selecting the Manage Reports icon from the versaSpinner - Administrators tab.
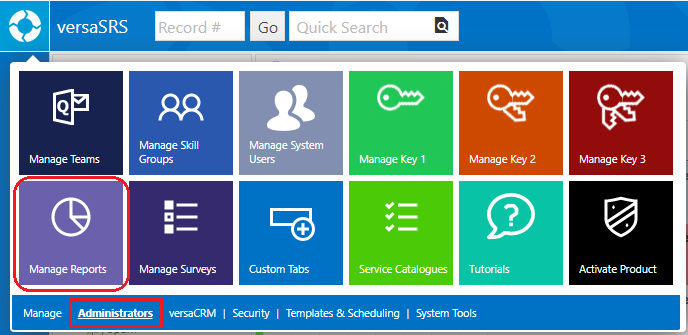
This will display the Reports window where you can create new Reports and update or rename existing Reports.
Note: It is not possible to make changes to the Standard Reports. If you wish to do this you will need to create a copy of the required Report.
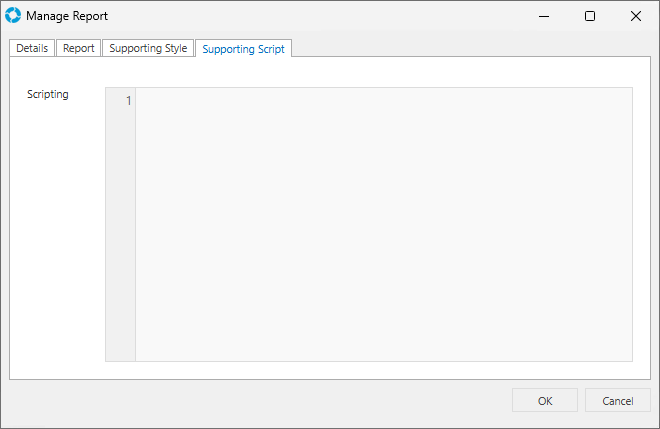
When creating new or editing existing Reports the Manage Report screen is displayed which consists of four tabs: Details, Report, Supporting Style, Supporting Script.
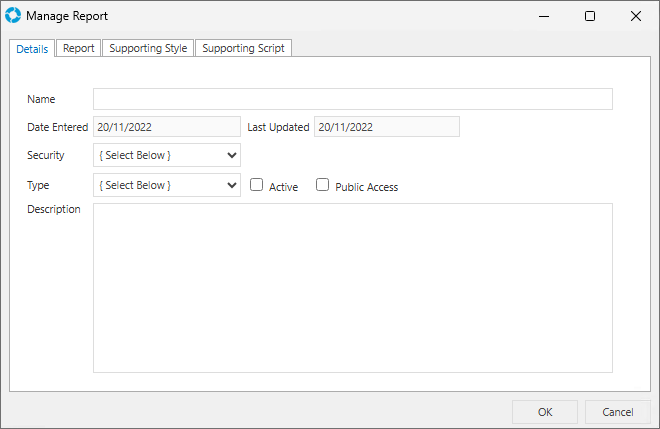
The Details tab contains the following fields/controls, the mandatory fields (denoted by a *) must be completed before you can save the Report.
| Field/Control | Description |
|---|---|
| Name * | The display name for the Report |
| Date Entered | The date that the Report was created, this field is auto-filled and cannot be edited |
| Last Updated | The date that the most recent changes were made to the Report, this field is auto-filled and cannot be edited |
| Security | Controls whether the Report can be run by a regular User or if they need administrative privileges |
| Type * | This will control what parameter filter options are displayed when the Report is run |
| Active | Ticking this results in the Report appearing to others when in the Report window or Report Scheduler |
| Public Access | Controls whether this Report will display on a versaBoard in SRSConnect or not |
| Description | Allows you to provide a brief overview of the purpose of the Report to Users |
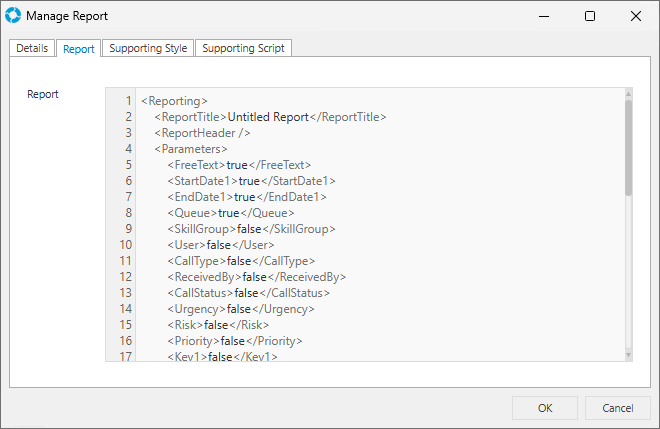
The Report tab contains the Report text area where the XML structured Report needs to be added. For more information on writing these Reports see the section Writing a Report.
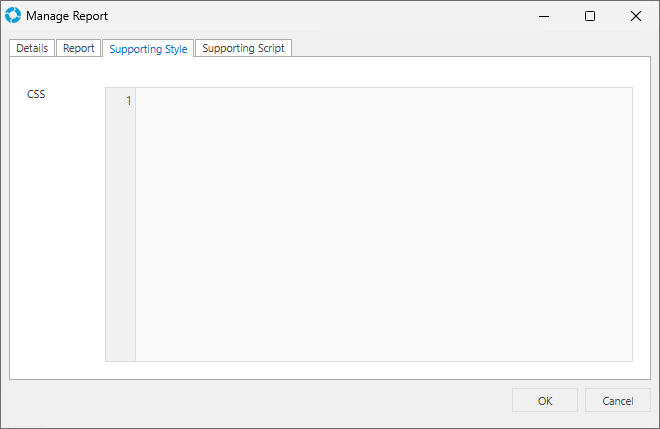
The Supporting Style tab contains the style text area where CSS can be written to set the style elements of the Report.
The Supporting Script tab contains the script text area which allows JavaScript and jQuery to be used to develop custom dynamic layouts and behaviour in the Report.