versaBoard Designer
Video Tutorial
What is versaBoard?
versaBoard is a module in versaSRS that allows Reports from the Reporting Dashboard to be displayed visually with charts and tables in a slide-show format. This can be used to present Record/System information on a screen in a rich graphic format that is populated at set time intervals as well as able to be triggered manually.
There are seven default versaBoards (pictured below) included within the latest version of versaSRS. The Reports shown on these boards are not able to be changed, however the versaBoard Properties can be, due to this the defaults in your instance may have different names/not be visible to all Users.

Launching versaBoard
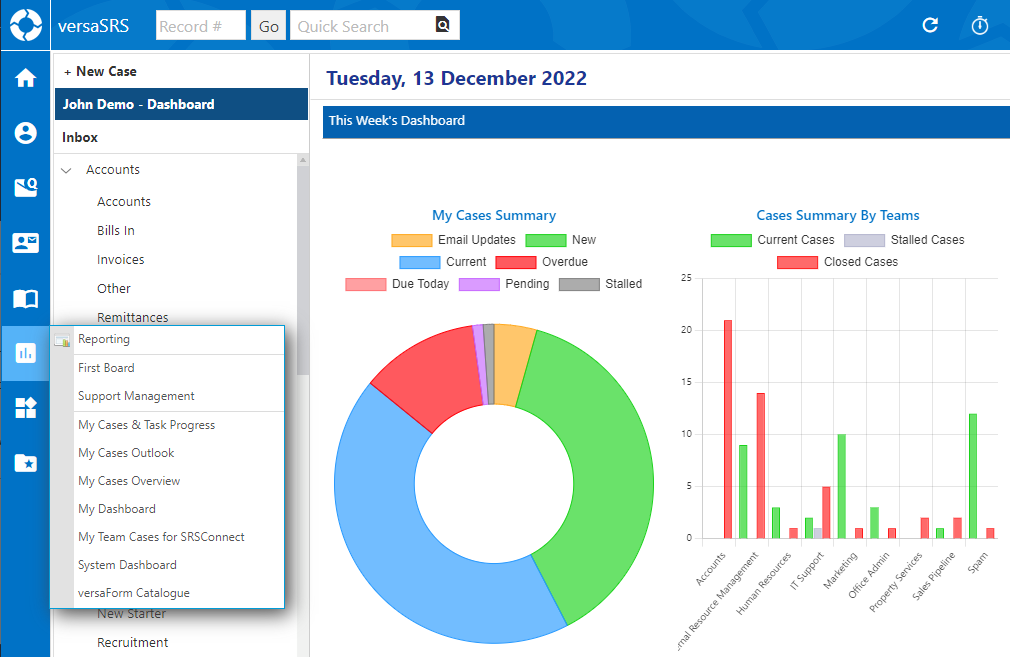
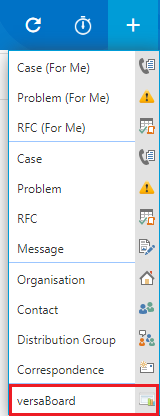
To launch a versaBoard in versaSRS select the Reports icon on the Navigation Sidebar then select the desired versaBoard from the available list.
NOTE: In the above example the URL needs to be correct for your instance of versaSRS and the #'s need to be replaced with the correct numeric values for the given board you wish to view.
Controlling the versaBoard interface
The versaBoard controls can be found by moving the mouse pointer to the top right of a viewed versaBoard, the control options available change depending on whether you are in design mode or not.
NOTE: Default versaBoards do not have the Toggle Designer icon available on the controls.
Standard View
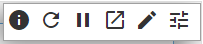
| Icon | Functionality |
|---|---|
| Info | About versaBoard module |
| Refresh | Refreshes the versaBoard |
| Pause/Play | Pauses/Plays the slide show |
| Open in New Window | Pops the versaBoard out into its own window |
| Toggle Designer | Enter the design mode for the versaBoard. This is how to access the Reports parameters and also the Toolbox where new Reports can be dragged and new versaBoards created. |
| versaBoard Filters* | Access to the Global Filters that apply to all Reports on the versaBoard. *By default this option is not displayed, it needs enabling |
Design Mode

| Icon | Functionality |
|---|---|
| Refresh | Refreshes the versaBoard |
| Open in New Window | Pops the versaBoard out into its own window |
| Settings | Display Page Settings where the Grid layout of the versaBoard can be specified, and the Global versaBoard Parameters enabled |
| Remove Page | Deletes the currently viewed page from the versaBoard |
| Add Page | Adds an extra page to the versaBoard being edited |
| Copy Page | Clone the currently viewed page of the versaBoard into another page on the same board. This is convenient if you want to have separate pages showing the same Report data but for different Teams. |
| Toggle versaBoard | Exit Design Mode |
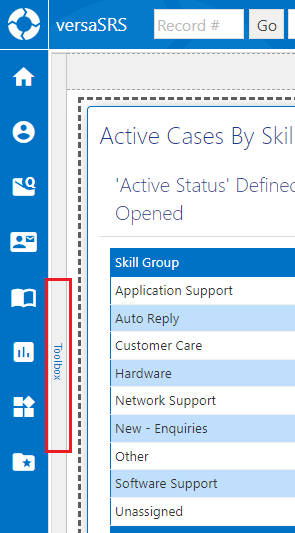
To enter the design mode of the board select the Toggle Designer icon from the versaBoard Controls.

When Designer Mode is active the Toolbox becomes available as a slideout on the left side of the panel, expanding this will show the available Reports that can be added to the versaBoard.
While in this mode the existing Reports on the board become editable, allowing for their positions to be changed by drag and drop, and different parameters selected.
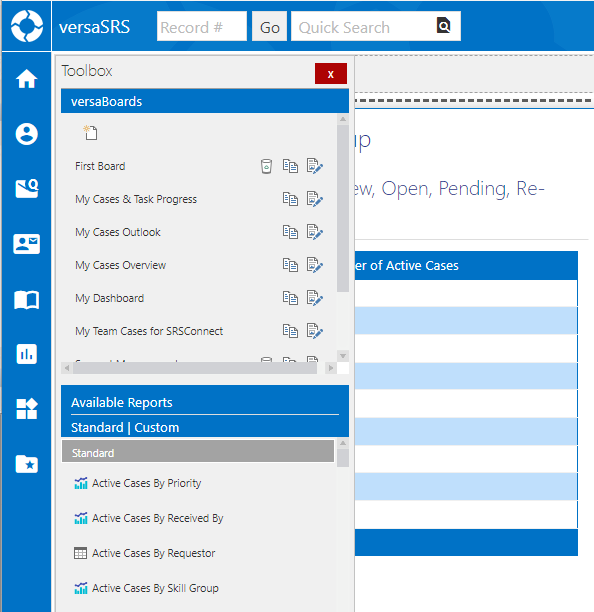
Within the ToolBox new versaBoards can be created, and existing ones can be edited and/or cloned.

Existing versaBoards can be deleted ( ), cloned (
 ), or edited (
 ) by clicking on the respective icon next to the target versaBoard.

Configuring Reports
Reporting Dashboard Reports can be added to the current page by dragging and dropping them from the ToolBox onto the versaBoard.

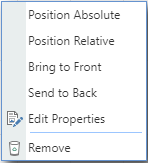
Once a Report is added it will need to be configured to show the desired data, right clicking anywhere on the Report will bring up the options menu.
| Option | Functionality |
|---|---|
| Position Absolute | The Report will be situated on the versaBoard where you place it, regardless of other Reports |
| Position Relative | The Report will be situated on the versaBoard relative to the other reports and the specified Grid layout |
| Bring to Front | When a Report has the position set to relative this option will make it appear first in the row of Reports |
| Send to Back | When a Report has the position set to relative this option will make it appear last in the row of Reports |
| Edit Properties | Displays the available properties (further explained below) that can be configured for the Report. This is where the parameters are defined. |
| Remove | Deletes the Report from the versaBoard |
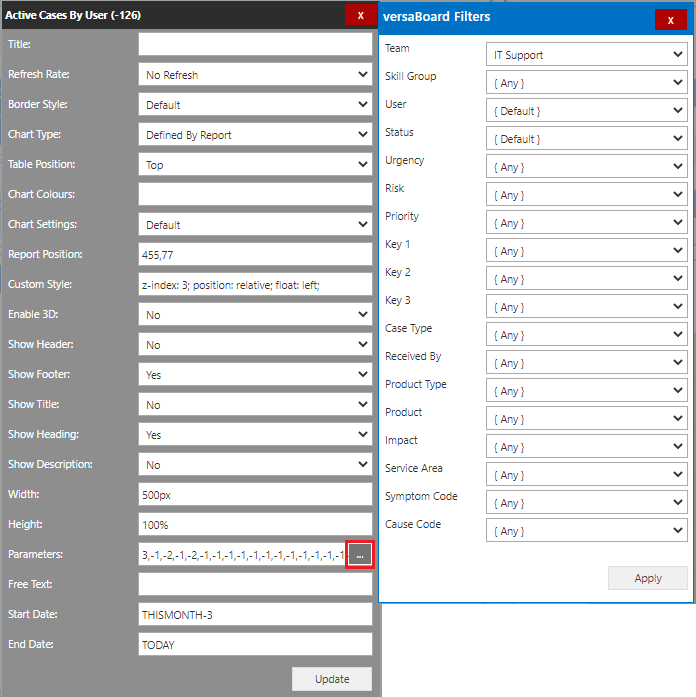
From the right click options menu selecting the Edit Properties option will bring up the Report Properties where the parameters for each Report are set. Clicking the icon with the 3 dots to the far right of the Parameters field will display the drop-down list parameter selections.
| Property | Functionality |
|---|---|
| Title | Specify a separate heading to use for the Report when displayed on the versaBoard |
| Refresh Rate | Sets the Refresh time interval (seconds) for the report. This allows individual Reports to update with new data independent from other Reports. |
| Border Style | Controls how the border around a Report is displayed |
| Chart Type | Allows the type of chart to be selected for the Report. Options include Defined By Report, Bar, Funnel, Line, Pie, None |
| Table Position | Specifies the Position of the data table. |
| Chart Colours | Allows the colour of the chart to be defined by using a colour hash code (i.e. #ff0000) |
| Chart Settings | Allows the setting of the chart to be defined which will change the way it looks. Only available on certain charting engines as defined in the Report. |
| Report Position | Shows/sets the position of the report. |
| Custom Style | Custom CSS that controls certain elements defining how the Report is displayed |
| Enable 3D | Allows the report to be displayed in 2D or 3D. Only available on certain charting engines as defined in the Report. |
| Show Header | Allows the Report Header to be displayed or hidden. |
| Show Footer | Allows the Report Footer to be displayed or hidden. |
| Show Title | Allows the Report Title to be displayed or hidden. |
| Show Heading | Allows the Report Heading to be displayed or hidden. |
| Show Description | Allow the Report Description to be displayed or hidden. |
| Width | Specifies the Width of the Report. |
| Height | Specifies the Height of the Report. |
| Parameters | Comma separated values specifying the parameters that are passed into the report. Clicking the 3 dots will open the parameters list where you can make the desired selections from each drop-down. |
| Free Text | The Free Text parameter used by the Report query. Report needs to contain free text parameter within the query to work. |
| Start Date | Allows the Start Date to be specified. Please see below for the Date Parameters that can be passed. |
| End Date | Allows the End Date to be specified. Please see below for the Date Parameters that can be passed. |
Date Parameters:
THISYEAR
THISMONTH
THISWEEK
THISDAY
Or
THISYEAR - n
THISMONTH - n
THISWEEK - n
THISDAY - n
Where n is a number.
Or
LASTYEAR
LASTMONTH
LASTWEEK
YESTERDAY
TODAY
Global Filters
As well as individual Report Parameters there are also Global versaBoard Filters that can be set to apply to all Reports within the versaBoard. This will only apply if the Reports used on the versaBoard utilise the parameters available.

To enable these filters you need to enter Design Mode for the specific versaBoard.
Once in Design Mode the Settings cog will be available in the Control options, select the Settings cog then check the Display Parameters option, and click OK to save.

Hover over the versaBoard controls, the versaBoard Filters icon will now be visible, clicking this will show the below pictured filter options.

NOTE: The Global filter settings will only apply to the versaBoard at the time they are set, once the board refreshes these values will reset to those set for each Report.
Publishing versaBoard
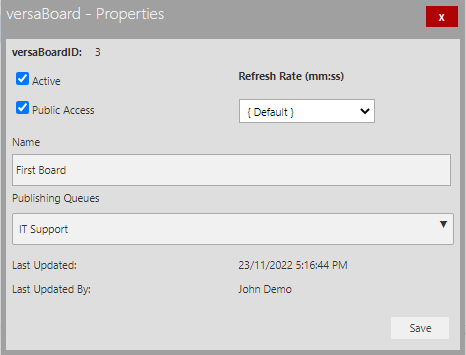
When publishing a versaBoard there are several settings that can be configured for each versaBoard. To access these properties you need to enter Design Mode.
In order for the versaBoard to be visible to specific versaSRS Users you must ensure the board has the Active checkbox ticked, and the necessary Team(s) selected in the Publishing Queues.
| Property | Functionality |
|---|---|
| versaBoard ID | Unique numeric value automatically assigned to the versaBoard upon it's creation. Cannot be changed. |
| Active | Makes the versaBoard visible to versaSRS Users who are members of the selected Teams for the Publishing Queues |
| Public Access | Makes the versaBoard visible to SRSConnect Users. The Publishing Queues list must contain a Team that has SRSConnect access enabled. |
| Refresh Rate | Sets the minute interval that the board will refresh the Reports and display any changes in the data returned |
| Name | Display name of the versaBoard |
| Publishing Queues | Drop-down list of all active Teams in versaSRS. For each Team that has the box checked the versaBoard will be visible to the Users. |
| Last Updated | Most recent date that changes were made to the versaBoard |
| Last Updated By | First and last name of the User who most recently changed the versaBoard |